In the challenging market conditions that we face today, reducing lift costs is paramount. One area where this can be achieved is through stimulation optimisation, ensuring reduce spend on stimulation activities and maximum oil or gas flow for a particular field.
In this post we examine five steps to achieving savings of as much as 20% in reservoir stimulation costs by using accurate flow data to optimise stage stimulation in individual wells and development of unconventional fields.
This is based on our vast experience across numerous fields and the insights and figures are taken from real projects conducted over the last few years.
The biggest benefit of measuring stimulation effectiveness is in planning future well designs within a particular field. Looking in more detail at what geology is successfully producing can reap significant benefits in production optimisation from the whole field as well as ensuring you are using the most effective stimulation technology for the geology. How can you ensure you are not wasting effort and resource stimulating stages within your wells that are yielding little or no product?
Step 1: Choose candidate wells to run competing stimulation strategies
Once you know which stimulation strategies you want to compare, you need to find two candidate wells with similar geophysical properties to run the strategies in. This will allow you to have as close to a like for like comparison as is achievable.
The challenge faced by many operators is understanding which stages of a well have been successfully stimulated. Factors that affect stimulation include the geology so it is imperative that these are similar within each candidate well.
Step 2: Choose stages to be measured and tag with tracer
One way to accurately pinpoint which stages have successfully been stimulated is to use smart tracers to tag various stages within a well. tagging the stages with unique tracers in both candidate wells ensures that comparisons can be drawn on the stimulation effectiveness within each well and on a stage by stage basis.
Tracers are very accurate - the oil and gas tracer partitioning coefficient, for example, are 100,000 times more favourable to oil or gas than water and they are unaffected by pumping systems.
Smart tracer is extremely easy to apply, being injected into the main flow of frac fluid at each stage. Tracer technology is well established and our customers have been using it for over 30 years in their conventional fields to measure fluid flow. It can be used to measure water oil and gas and we have a large number of unique tracers meaning many stages can be measured in one frac completion.
Step 3: Sampling and analysis
Samples must be collected from both wells at the same time intervals. Typically we would expect to collect samples twice a day for the first ten days, then once a day for the remainder of the first month, then weekly. The tracing process can last anywhere from a month to beyond a year depending on the flow of the well, in a recent case in the Eagle Ford Shale after one month of sampling there was enough data to identify the stages being affected by stimulation and the most successful stimulation strategy.
In terms of gathering samples they can be collected by the operators with specialist kits that we provide, and sent to our specialist world-wide labs or, with the introduction of our new mobile labs, we can do on-site analysis for instant feedback.
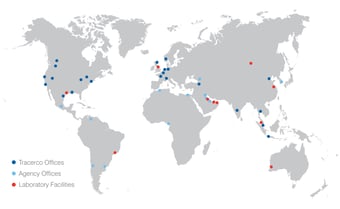
Labs are located around the globe (see map) and we have recently added to our capabilities in Russia and Perth, Australia.
After just ten days, we produce an early-time report, followed up by monthly reports, with the stage that produces all of its tracer first revealed as the most prolific stage in the well.
Step 4: Data interpretation and results
The data from these reports is vital in establishing stimulation effectiveness. A recent example from the Eagle Ford Shale showed some interesting results that demonstrated how effective tracers were in optimising field development plans and saving on stimulation budgets.
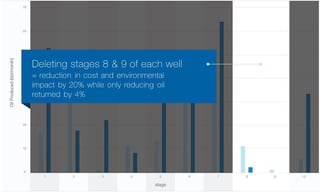
Tracer response from the samples showed that , one stimulation strategy yielded 18,000 barrels per month whilst the second stimulation strategy yielded 30% more product at 26,000 barrels per month with no anomaly showing majority flow from one stage due to unforeseen geological properties.
Furthermore, when the data was analyzed in greater detail it showed that in both strategies the stimulation was ineffective in stages eight and nine of each well (see graph). Reducing the stimulation of these two stages in either strategy would yield a 20% reduction in stimulation costs with only a 4% reduction in oil production, which is effectively offset by the saving.
Ultimately you can confidently optimise development plans through the additional data gained from a smart tracer project.
Step 5: Apply data to field development plans
The study will allow you to compare two stimulation methods as well as identify unproductive zones within the formation to ensure you can use the most effective strategy in future wells. This will enable significant cost savings in stimulation budgets and most importantly optimise field development plans for the best results in terms of production.
Using smart tracers can save you as much as 20% in stimulation costs and increase production in future wells by 40%+. Optimising stimulation strategy in this way is an effective way to reduce lift costs. Using tracers to measure the effectiveness of different stimulation strategies on a stage by stage basis in similar geophysical wells means we can optimize development plans moving forward.
We hope you have found this post useful and if you want to learn more you can download the case study. You can also read our previous post, save up to 66% of drilling costs in your frac applications or learn about or glbal capabilities by reading our post; Saudi Arabia, Russia, and Australia: Taking reservoir analysis to you. If you have enjoyed this post sign up for updates using the form on this page.
When do you think the oil price will return? Let us know in the comments below.
