Understanding zonal contribution is imperative when developing stacked plays where a primary appraisal objective is to quantify zonal productivity to determine which layers of the formation to target. One proven evaluation method is the use of chemical-based tracer technology. In this blog post we will provide a real case example of where chemical tracer technology was used to determine zonal contribution and assist in the planning of future well and field development.
In one field, unique oil phase chemical tracers were applied in multiple target zones of several test wells, with the objective of identifying the optimum zones for future development. Chemical tracers were selected as the primary evaluation tool due to their ability to measure inflow over a long time with measurement of zonal contribution variation. This approach eliminated one of the primary drawbacks associated with tool based zonal contribution measurements, as these only provide zonal performance at the time of measurement. In order to assure suitability of chemical tracer use, part of the study compared tool based measurements with tracer observation to confirm reliability.
Chemical based tracers are available in gas, oil and water phases and mixed with the fracture fluid that carries them into a stage fracture matrix where they mix with the in-situ oil, gas or water phases. Tracers flow with oil, gas or water and surface sample analysis identifies the presence and concentration of each tracer’s unique signature. Comparison of the amounts of each tracer in samples is a direct indication of stage production contribution. Sequential samples provide a changing “Tracer Production Log™” or TPL indicating stage production variations.
In this example four vertical wells were drilled intersecting five target zones within a stacked play. Each well was fractured with multiple stages in each zone. A summary of oil tracer flow back data over six months from the targeted zones in the four wells is presented in Figures 1a & 1b. Figure 1a shows individual production of each zone from each well. Figure 1b presents a compilation of the overall zonal oil production from the four wells.
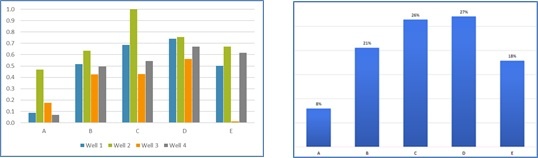
Figure 1a – Zonal Contribution Ratio (Oil) by Wellbore Figure 1b – Overall Zonal Contribution Ratio (Oil)
Zonal contributions indicated that zone A was the least productive and zones C & D were the most productive. However, a review of individual variation between wells showed that zone C had greater production variability across the field as compared to zone D. This could be due to variations in rock properties in zone C. Zone D may have had more consistent rock properties across the field giving higher confidence to target with horizontal wells.
Tracer Observation Confirmation via Sliding Sleeve and PLT Testing
A production test of zonal contribution using sliding sleeves installed in one well was carried out. Production was isolated to each zone by mechanically closing all but one sleeve for a two-week period. Flow from Zone A was blocked by a bridge plug during this testing, thus data was not available. Flow rates for each condition were then compared.
The comparison of oil production measured with open sleeves and tracer technology is shown in Figure 2. Agreement between the methods was confirmed and was consistent with zonal production measurement in Figure 1a. A PLT in well 1 was also run with data shown in Figure 3.
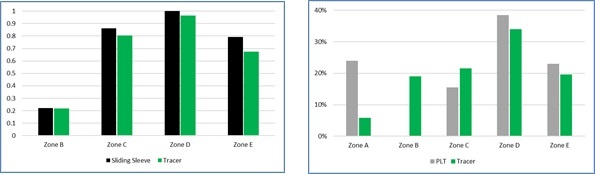
Figure 2 – Sliding Sleeve vs. Tracer Figure 3 – PLT vs. Tracer
The PLT and tracer results were in good agreement for zones C, D, and E. It was not possible for the PLT to distinguish the individual contributions of zone A and zone B due to obstructions to tool movement. Overall, both technologies yielded similar zonal contributions based upon a combined flow from zones A and B and individual flows from zones C, D, and E.
Flow Contribution over Time Using Tracer Data
One of the main advantages of tracer technology is the ability to capture continuous data without shutting in the well through sampling and analysis. Figure 4 shows the zonal contribution variation of each zone over 150 equivalent days. This type of knowledge helped in understanding the effectiveness of the well stimulation program and characterizing the true potential of the reservoir. A single snapshot in time will not capture the true potential of a zone if it is changing with time.
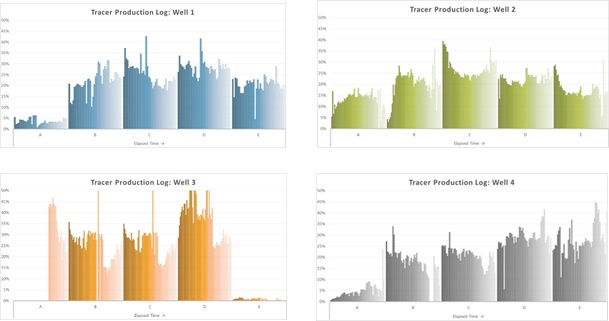
Figure 4 – Flow Contribution over Time
As an example, zone C generally showed a declining production trend with time during the test whilst zone D showed the most stable production during the time period, again suggesting it is the best target for further development.
Conclusions
Chemical tracer technology gave insight into the zonal production contribution and helped dictate most productive zones for future horizontal well development in a stacked reservoir. The tracer results of zonal contribution were in agreement with zonal contribution results from PLT and sliding sleeve testing. In addition, tracer results clearly indicated that production contribution from individual stage and zones varied over time.
Watch our webcast 'Frac Smarter with Hydrocarbon tracers' to find out more on how a Tracer Production Log™ (TPL) can allow you to cost effectively optimize development plans and maximize reservoir production.
