Tracerco, patented, pioneered and continues to enhance technology that enables the measurement of individual gas, oil, and water stage production along the length of a wellbore, without well intervention. This inexpensive technology provides confirmation that a wellbore is open to flow, identifies and quantifies stage flow contribution of each phase, and provides measurement of drainage area connectivity - simply by adding small amounts of unique chemical tracers to each stage’s stimulation fluid.
The accurate knowledge of individual stage production allows a correlation between zonal productivity and wellbore position within a formation, stimulation, and production design. Using this knowledge, future well development plans can be adjusted with confidence to ensure that any changes made, will result in enhanced ultimate hydrocarbon recovery.
There are a number of surveillance tools that can be used to gather information on how best to drill and stimulate a well. These include Seismic, Micro-Seismic, Core, and multiple specialist log data sets. Historically, it has been difficult to place faith in surveillance data to vary future drilling or stimulation activities. At best, there was no confirmation that recovery would improve if the data was used to change the program design. Or worse still, one data set was inconsistent with another, leaving the operator unsure which to believe. Tracerco technology offers a method to prove the accuracy of these measurements, providing operators with confidence when planning future well and field development.
Figure 1 shows a Gamma Ray (GR) heat map and landing position of an unconventional well, relative to the expected top of varied geological layers. The target zone was the area between B and C. The GR heat map turns red where the well was drilled lower than the target zone (toe stages) and blue when above the target zone (middle stages). These GR observations supported geological expectations.
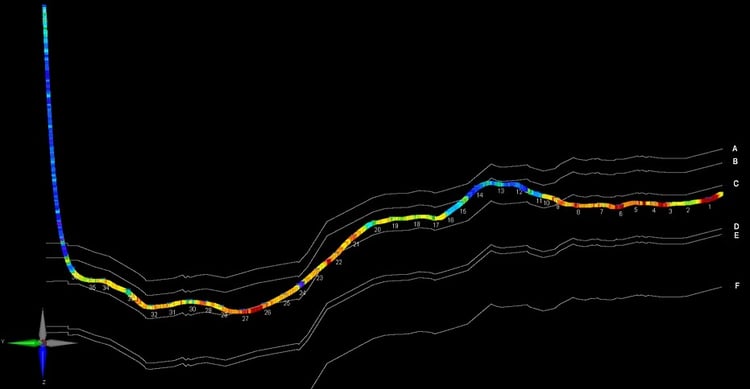
Figure 1
Figure 2 illustrates the measurement of stage fluid production using chemical tracers. The red bars provide a measure of the cumulative gas produced during the operation, whilst the blue bars present water production. One of the primary observations is that drilling out of zone low (toe stages) resulted in reduced gas production and increased water production. Drilling out of zone high (middle stages) was not detrimental. These stages showed effective hydrocarbon production without suffering from increased water. Armed with this knowledge and by incorporating real time GR monitoring during drilling , the operator was better positioned to efficiently complete future wells in the field and remain in the more productive rock.
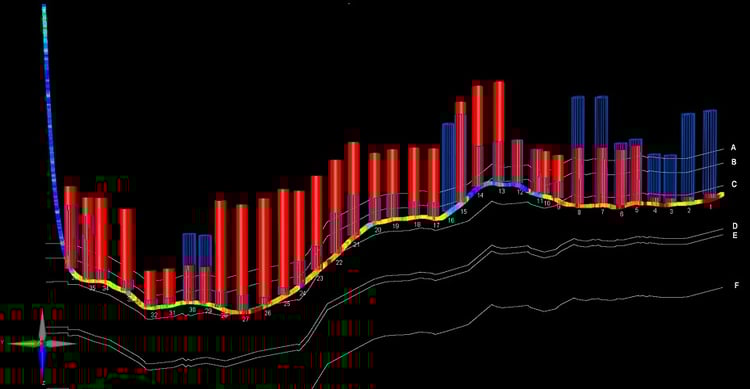
Figure 2
Figure 3, shows the landing and GR responses of a pair of step out wells (2H and 3H), drilled offset from an existing producer (1H). It was surprising to observe communication between the new offset wells without communicating to the parent well in the middle, particularly since spacing between wells was over 1000'. As mentioned in Figure 1, the reasons as to why lay in the landing and GR observations. Closer review showed a variation in well landing depth. This was particularly apparent when comparing the GR (blue/green) of the offset wells against those of the parent (yellow/red). When all data was reviewed, it was clear to see that the dip in the parent well was 30' lower than the corresponding offsets in this region.
Figure 3 also shows stage fluid communication between wells, with 2H and 3H showing strong cross flow but no presence in well 1H. This indicated that an impermeable boundary existed between depths at which the wells had been drilled. It is also worth noting that the major communication path aligned with the direction of minimal horizontal stress, as shown by the arrow.
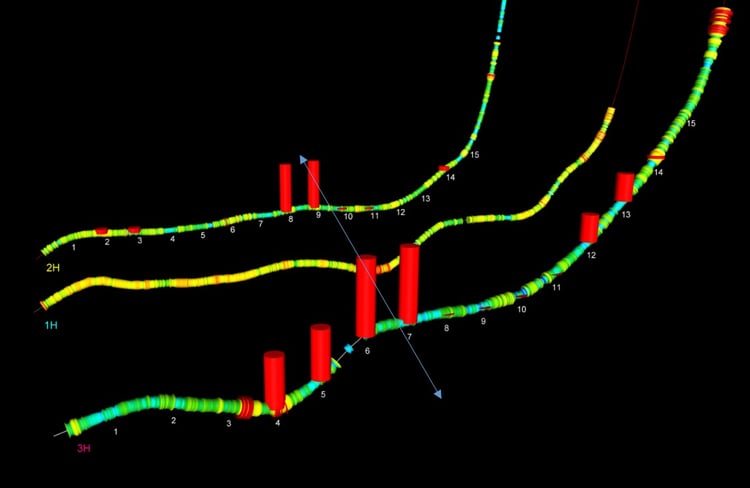
Figure 3
This boundary information turned out to be a positive for the operator as its presence was further supported by individual stage production of the offset wells. As shown in figure 4, higher hydrocarbon production was associated with sections of the offset wells that had been drilled above the parent well elevation. Also note the increased production from stages in the center section of the horizontals that was believed to result from accessing rock, not previously produced by the parent well.
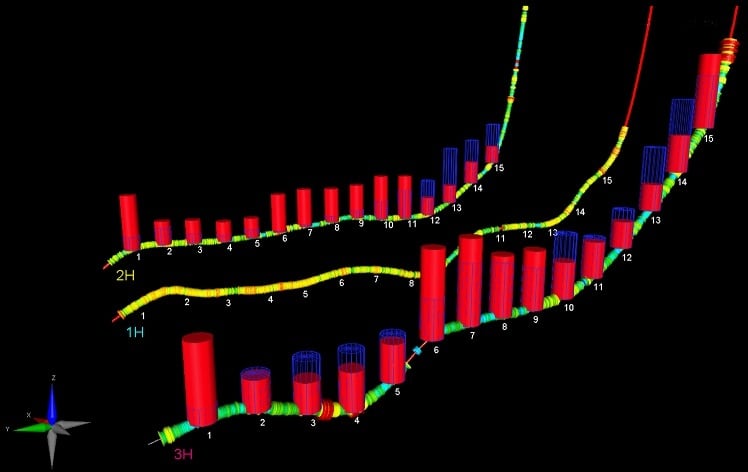
Figure 4
Tracerco frac tracer technology has become the industry standard methodology to identify stage production of gas, oil, and water along the length of a wellbore. Using this knowledge, the operator can evaluate drilling, stimulation, and production decisions and extract the full benefit of pre-completion seismic and geophysical diagnostics (seismic, log, micro seismic, landing zone, etc.) to ensure enhanced ultimate hydrocarbon recovery.
Watch our webcast “Productivity Improvements Through Integrated Analysis of Frac Tracer, Geophysical and Stimulation Data” to learn more about how Tracerco’s Reservoir Characterization technology can allow you to maximise field development and optimise flowback operations.