Selection of the stimulation target in unconventional shale formations is an important factor that impacts well productivity. In thick unconventional formations, it is essential that operators quantify the production of each stage of hydraulic fracturing executed in the well, in order to establish the most productive rock. It is also important for operators to be certain that every section of the stimulated well is effectively contributing to overall well production and clean-out of all stages has been achieved. In addition, other development challenges include optimal spacing between perforation clusters, stages and wells, allowing operators to optimize drilling and completion costs and maximize enhanced ultimate recovery (EUR).
This Blog describes the application of chemical tracers in a multi-stage horizontal well to gain insight on stage productivity in order to plan an optimal field development strategy.
Well Flow Back
Following the start-up of a stimulated well that had been traced with oil and water chemicals during stimulation, we determined oil, water and gas flow rates, choke change positions and flowing wellhead pressure (Figure 1). Upon flow back, a series of samples were taken and analysed for the presence and concentration of each unique tracer applied to each fracture stage.
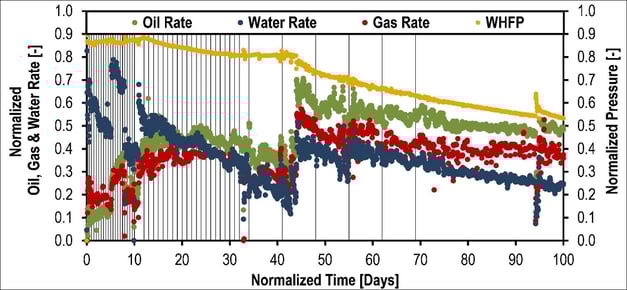
Figure 1 - Pressure and Rate normalized chart
Tracer Interpretation
The measured concentrations of tracer in each sample, together with the cumulative production of oil and water were used to calculate tracer mass recovery during the study.
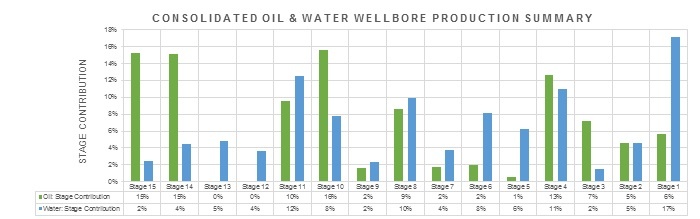
Figure 2 - Consolidated flow profile of the well, during the whole study
Based upon the data shown in Figure 2, the well was divided into three distinct regions:
- Stages 15-10: In general, heel stages showed good oil production, with low water flow back. This was most probably due to a fast and effective clean-up of the stages, and better stimulation efficiency.
- Stages 9-5: The mid region of the well showed an inconsistent profile, with low oil tracer recovery, and hence low oil production.
- Stages 4-1: The toe of the well showed considerable production, confirming that the whole wellbore was productive and contributing to flow (no obstructions).
In addition to the consolidated flow profile, which included the whole study time period, analysis on a sample-by-sample basis was also carried out. In Figures 3 and 4, the trend over time of oil and flow back water contribution per stage can be observed.
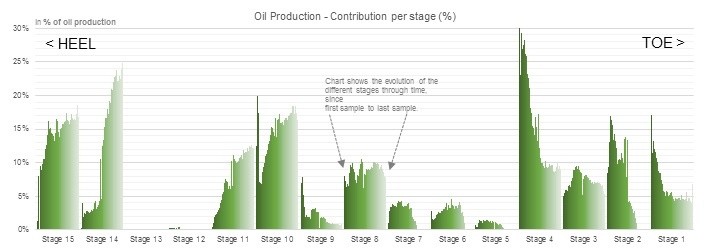
Figure 3 - Evolution over time of the contribution of oil in each stage.
In Figure 3, it was shown that throughout the sample period the relative percentage contribution of oil in each stage experienced significant changes. In particular, the toe region (stages 4-1) had a decreasing trend over time, stabilizing at values lower than during the start of the study. However, the heel region (stages 15-10) gained importance and was clearly the dominant region towards the end of the study period. These changes were related to total oil production in the well, and changes in operating conditions.
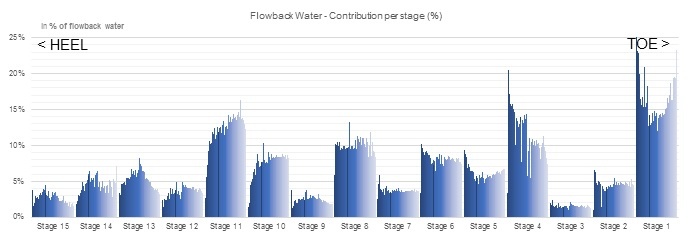
Figure 4 - Evolution over time of the flow back water per stage.
The flow back water contribution of each of the different stages showed a fairly stable profile throughout the study period, with changes in operational parameters at surface not affecting the flow back water distribution per stage, as shown in Figure 4.
During the study, a total of five different flow periods were identified (Figure 5) that were differentiated by choke size used. Each period had considerable differences in terms of oil production rate. In addition to the oil production increase, each choke change showed a redistribution of oil production throughout the stages in the well, as measured using the oil tracer response. This allowed the region of the well most responsible for such increments in oil production to be determined.
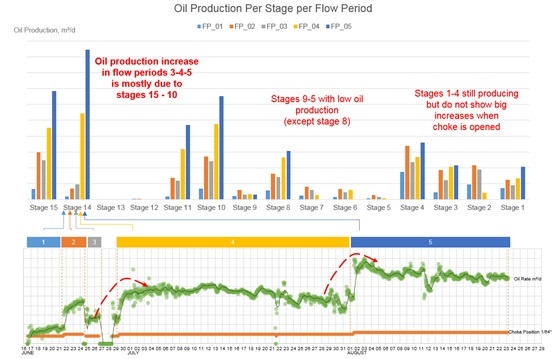
Figure 5 - Division of the whole study period into 5 flow periods (below), and the oil rate per stage in each flow period (above).
The results showed that the region most responsible for oil production increase was the heel section (stages 15-10). Another way of showing this trend was with an oil production chart (Figure 6), grouped by region of the well, divided into heel, mid and toe.
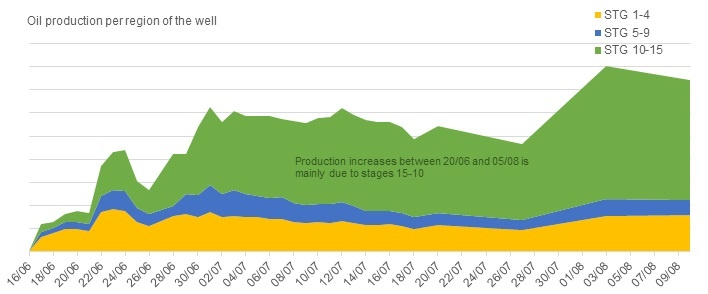
Figure 6 - Oil production per region of the well, dividing the well into three regions: Heel, stages 15-10 in green; mid, stages 9-5 in blue; and toe, stages 4-1 in yellow.
As described in Figure 4, the operational changes had low influence on the water flow back distribution in this well. This fact reinforced the importance of correlating oil production to oil-specific tracers, and confirmed that water flow back behavior did not necessarily follow oil production changes in the different well zones.
Conclusion
Chemical tracer technology was used to show changes in production over time, stage by stage, in a multi-fractured well. It provided long term measurement of well behavior, improving the understanding of the unconventional reservoir through insight into the individual contribution of each stage in the well.
The conclusions obtained were used during the development of other wells or neighboring areas that navigated through the same horizons, to optimize production, costs and benefit economics of the field development.
Watch our webcast “Productivity Improvements Through Integrated Analysis of Frac Tracer, Geophysical and Stimulation Data” to learn more about how Tracerco’s Reservoir Characterization technology can allow you to maximize field development and optimize flow back operations.