
Optimizing Desalter Performance is Just One of Tracerco's Specialties We Proudly Provide.
Desalter vessels are a refinery’s first line of defense to reduce the amount of unwanted salts present in the feed inventory. Prior to crude oil entering a refinery processing stream it undergoes a water washing stage where the water used during this process is separated using Desalter vessels. In these vessels the oil and water mixture separate from each other using gravity and high voltage coalescing plates. The water phase contains the washed salts as well as other suspended solids. Desalting and separation prevents water and salts from entering the crude unit furnaces, distillation towers and other downstream equipment. Salts, sediment, and other solids will foul the process and can undergo chemical change to produce corrosive chemicals that cause damage to process metallurgy. It is therefore important to efficiently separate wastewater from crude feedstock within the Desalter vessels.
Tracerco Tru-Scan™ technology provides you detailed data on where the oil/water interface level is, determines if there is a significant “rag” or emulsion layer or detects how many solids are built up in the bottom of the Desalter. In addition to performing these applications our advanced tracer studies are used to provide residence times of the oil and water phases and distribution within the vessel. Further to our scanning and tracer technologies that can aid plant personnel in optimizing your process, our award winning Tracerco Profiler™ HTX instrument provides accurate phase measurement including oil, emulsion (rag), water and solids/sludge in real time. The installation of the Tracerco Profiler™ HTX can eliminate unplanned Desalter shutdowns, reduce chemical usage, increase fluid throughput and provide the capability to handle more challenging crude blends.
Read more to learn how Tracerco helped our customer determine what was actually happening within their Desalter.
Case Study: Desalter Distribution Study
Recently a customer contacted Tracerco asking if we could provide an answer to his question: “Is the liquid that is being introduced into my Desalter being evenly distributed via my distributor? They suspected the inlet distributor on their Desalter may not be functioning properly.
A Tracerco Diagnostics™ Distribution study was performed to help the customer determine what was actually happening within their Desalter.
In this study, an organic tracer was used to verify the oil distribution through the inlet distributor which was located in the middle of the vessel.
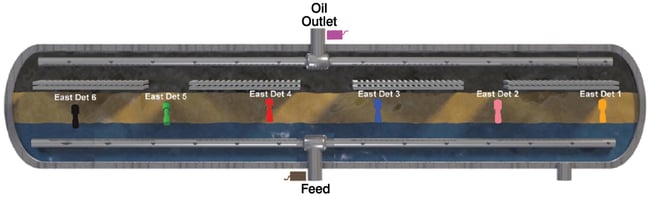
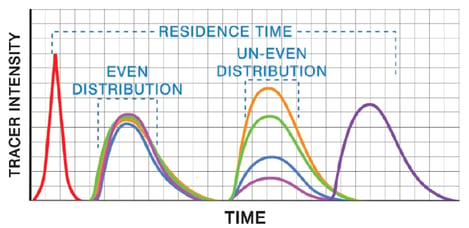
(Figure 1) Sensitive detectors were placed on the feed inlet and oil outlet as well as various locations on the East and West sides of the vessel to monitor for the presence of the tracer and evaluate the quality of distribution at the entrance and exit points. Each of the detectors should have equal area response if there is good distribution as illustrated in the example shown in Figure 2.
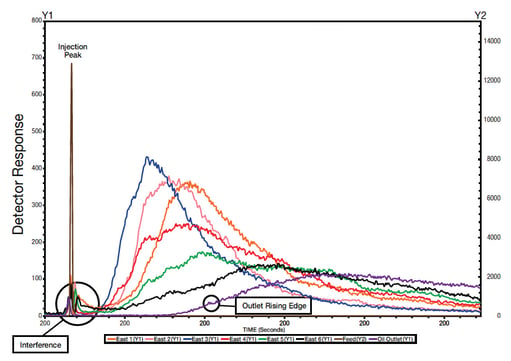
The results of the study are illustrated in Figure 3. The data indicated a much different flow pattern when comparing the detectors on the North side of the vessel (red, green, black) as those on the South side (blue, pink, orange). On the South side of the vessel, the detector response curves were sharp with well-defined leading and trailing edges. By comparison, the detector response curves on the North side of the vessel showed very broad curves with leading and trailing edges spread out over a very long period of time. This was an indication that the feed distribution was not properly distributing the feed to both sides of the vessel. There appeared to be a much higher flow of feed to the South as compared to the North. If the distribution would have been even, then the North and South detectors would be expected to have shown uniform response curves.
Conclusion
Online investigations of desalters can identify the causes of poor performance. Once identified, the best course of action can be determined to correct the problem in the least amount of time. With a Tracerco Diagnostics™ Distribution study you can identify problems before they reach a critical point.
Click here to download a copy of our Desalter Factsheet.
For questions concerning this article please completed the form shown below this blog.