Scans aid plant personnel in determining which demulsifier is best suited for their application.
Tracerco’s scanning technology is an excellent means of measuring interface levels, whether between vapour and liquids, liquid and solids, or between two different types of liquids. Tru-Scan™ and PhaseFinder™ neutron scanning technologies can be used very effectively in trials of emulsion breaking chemicals to determine the best type and concentration to use in a particular vessel. This can lead to increased efficiency and significant cost savings as well as reduce the environmental impact of excess chemical use.
This blog will present two demulsifier trials that will show the difference in performance base on the presence or absence of an emulsion layer.
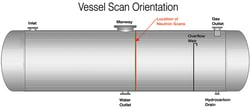
A Tracerco customer requested scans of their separator to determine the effectiveness of two different demulsifier chemicals that they were testing to select which was the most cost effective. The separator was scanned on two different days. A Tru-Scan™ was performed each day on the separator before and after the demulsifier was added to identify the bulk liquid level. There were four PhaseFinder™ neutron scans performed on the separator, two baseline scans and two scans after the different demulsifier chemicals were added. The scan locations are shown in the figure below.

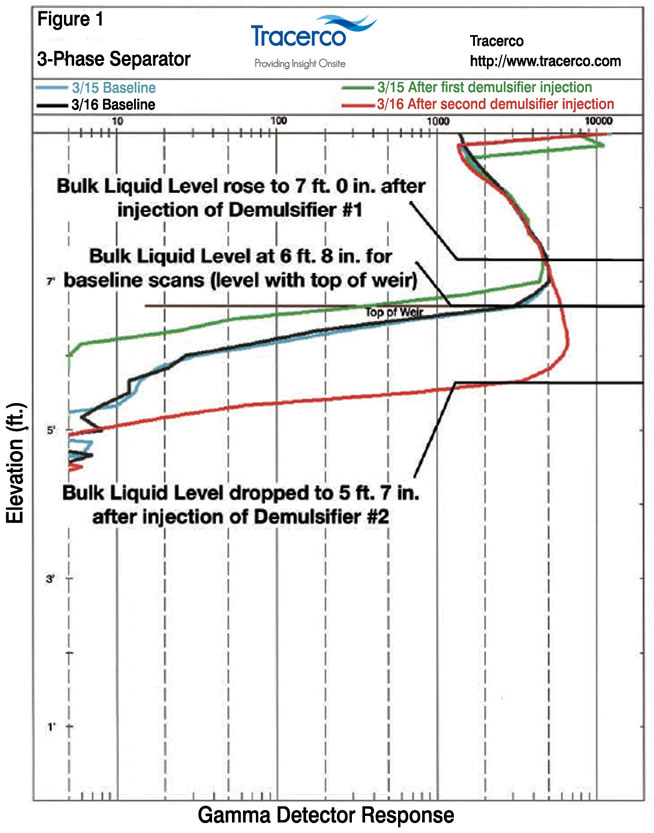
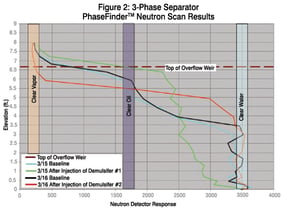
Results of each Tru-Scan™ performed are illustrated in the plot shown in Figure 1. These scans were used to indicate the liquid level and any foam or froth layers. The PhaseFinder™ neutron scan results are illustrated in Figure 2. These scans were used to indicate the interface quality between oil and water phases.


Demulsifier #1 Trials
Baseline Tru-Scan™ results for the trials of Demulsifier #1 showed an overall liquid level on the water side of the weir equal to the height of the weir. However, this liquid level consisted of a layer of froth or foam on top of the water (Figure 1: light blue scanline). The PhaseFinder™ baseline scan (Figure 2: light blue curve) showed that there was approximately 107cm (3.5 ft) of clear water at the bottom of the separator. A gradual reduction in response was observed from the 107cm (3.5 ft) elevation up to the top of the weir which would be caused by emulsion or foam.
The Tru-Scan™ after Demulsifier #1 was injected showed that the overall liquid level on the water side of the weir had risen by about 2.5 cm (4 in). (Figure 1: green scanline) The follow-up neutron survey (Figure 2: green scanline) performed showed a severe emulsion had been created, with evidence of less than 15 cm (6 in) of clear water in the bottom of the vessel.
Demulsifier #2 Trials
The baseline Tru-Scan™ and PhaseFinder™ neutron scan (Figures 1 and 2: black scanlines) performed the next day showed that the conditions inside the separator had returned to the original baseline conditions seen on the previous day.
Demulsifier #2 was added and the scans were repeated. Results (Figure 2: red scanline) indicated that the overall liquid level on the water side of the weir had dropped 33cm (13 in). The neutron survey results showed that there was no emulsion layer on top of the water level (Figure 2: red scanline).
Customer Conclusion
The combined use of Tru-Scan™ and PhaseFinder™ scans to measure the overall liquid level and any existing intermediate layers, such as foam or emulsion, allowed the customer to test the effectiveness of two demulsifier chemcials in their process. The scan results clearly showed the difference in performance based on the presence or absence of an emulsion layer. In this particular test one demulsifier chemical was obviously superior to the other in preventing the creation of an emulsion in their process.
Click here to download a copy of our Tracerco Diagnostics™ Services for the Refining and Petrochemcial Industries brochure.
If you want to learn more about Tracerco's scanning technology please complete the form on our contact us page at http://www.tracerco.com/contact-us and request additional case studies or to schedule a lunch and learn presentation.