 There are a number of problems that can cause a loss of efficiency and lead to loss of production in a distillation column, including tray damage, flooding, weeping, and foaming. Gamma scan technology available from Tracerco can be utilised to locate the origin and/or severity of these problems. A Tru-Scan™ across the active area of a fractionation tray can provide hydraulic conditions and/or mechanical status of the active area, such as weeping and tray froth heights. FrothView™, a new methodology developed by Tracerco, provides a quantitative analysis of tray capacity as the total froth height on a tray that is measured using Tracerco's new detector technology and software interpretation.
In this latest blog post we will discuss how a Tru-Scan™ and FrothView™ technology was used to provide the % tray space to show the amount or percentage of available tray spacing that is occupied by froth or aerated liquid. Knowledge of the actual process conditions inside a vessel, provides engineers with the ability to make process adjustments accordingly.
Project Field Test
A trayed fractionation tower was scanned to demonstrate the differences between the  standard method of calculating tray liquid height and the new FrothView™ analysis. Figure 1 shows the data plot from one tray active area scan. The tray liquid heights shown in Figure 1 represent results using the standard method of analysis.
The scan showed the tower to be in good operating condition with nothing dramatic detected indicating any hydraulic problems or limitations. Illustrated in the scan results is a red dotted line indicating the “liquid level” line. This line is used to measure the median level of liquid being held on each of the fractionator’s trays. The final diagnosis from the scan results profile using the old method would be to state that the trays are typically holding 18-23cm (7-9in) of liquid and operating with moderate-to-heavy or heavy entrainment.
What would this mean to you as our customer and Plant Engineer? On the one hand it is good that you are not flooding and your trays do not seem to be damaged but what does “moderate-to-heavy entrainment” tell you exactly?
This is where FrothView™ technology offers more quantifiable and less subjective information using the same scan data. Figure 1 - Illustrates the standard method of analysis from a group of trays showing tray liquid heights.
Project Analysis
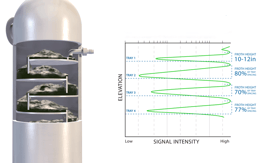
Figure 2 shows the scan data from Figure 1 but now the total tray froth heights measured using 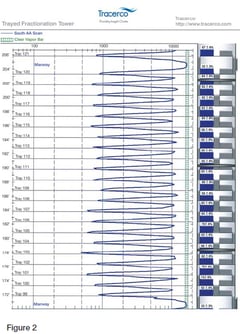 FrothView™ have been divided by the existing tray spacing to provide the % tray space. Tracerco uses the term % tray space to show the amount or percentage of the available tray spacing that is occupied by froth or aerated liquid. Our goal with the method is to measure the very top of the froth layer. For the group of trays shown in Figure 1 the total froth heights range from 25-30cm (10-12in) to 33-38cm (13-15in). This equates to the trays operating with 58-74% occupied tray spacing. The % tray space is a good field measurement proxy for % flood. Therefore at the operating conditions where the scan was performed the tray rating calculations show % flood in the 60-80 % range. These numerical results allow a more specific measurement of the towers operational condition versus hydraulic capacity of the trays. Coupled with tray rating calculations this data can be used to estimate available capacity if hydraulic loading is increased.
Customer Conclusion
It is always easier to understand and discuss technical issues when quantitative information can be used to compare operational parameters with engineering design. It is Tracerco’s goal that the use of our patent pending FrothView™ analysis will improve the value of Tru-Scan™ data and facilitate improvements in the operation of mass transfer equipment. Tracerco would be more than happy to visit your site to provide a lunch and learn presentation to further explain and demonstrate our gamma scanning technology.
Through careful application and interpretation of Tracerco’s new FrothView™ technology we can now provide quantitative information about the useful capacity of process equipment that can be used to optimise performance.
If you want to learn more about how Tracerco technologies provide insight onsite, request more information here