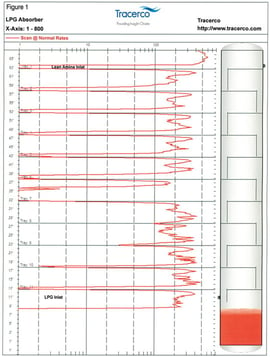

In this particular absorber there was a relatively large density difference between the amine (sp. gr. 1.0 – 1.1) and the LPG (0.5 – 0.6). The scan profile of trays operating normally closely resembles what would be seen from a typical liquid-vapour fractionation tower. The big difference is in the magnitude of gamma-rays passing through the column. Note the horizontal X-axis scale, which was 1 – 800 in Figure 1. In a typical fractionation tower the maximum counts would be in the high 1,000’s due to the much lower density of the vapour phase.
Note the change in the scan profile at Tray 7. Tray 7 has a level of dense phase liquid measuring approximately 38 inches (965 mm), much higher than the trays above. In addition Trays 8, 9, and 10 did not appear to have any appreciable level of dense phase liquid. The scan results showed that the amine or heavy phase liquid cannot flow past Tray 7 most likely due to a restriction in the downcomer from Tray 7. Trays 8 – 10 actually were “starved” of amine so only the light phase liquid LPG was seen on these trays. The customer was now aware of the type of operating bottleneck they had and were able to formulate an action plan to remedy the situation.
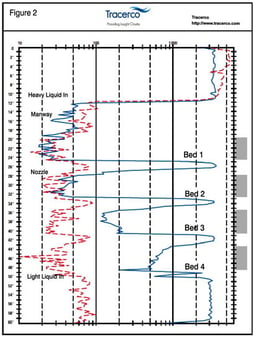
Figure 2 shows the scan results from an extraction tower with packed beds. If the two liquid phases were well mixed then the scan profile would be nearly a straight line due to the process density being uniform throughout the tower. The red-dashed scanline curve in Figure 2 shows this. The blue-solid scanline shows what the extractor looked like when it had operating problems. First, pockets of lower density material were noticeable below each bed, showing that the light liquid phase was not able to flow through the packed beds. Second, Beds 3 and 4 were much lighter in density than Beds 1 and 2. Thus the tower was not well mixed but holding the light liquid phase in the bottom and keeping the heavy liquid phase in the top.
 This situation was due to the bottom of each bed of packing having a layer of fouling. The scan results showing good mixing were obtained after the extractor tower had been cleaned and returned to service (red-dashed scanline).
One indirect result from the scan when the tower operation was bad was being able to determine that the bed placement was correct. Normally it would be very difficult to see where the beds are located from a scan when the extractor was in good operating condition due to all the liquid. However when the operation was bad, the pockets of light liquid trapped under each bed in the scan clearly identified where the beds were. It is ironic but a scan of a well operating liquid-liquid extractor usually reveals less information than a scan of an extractor with problems.
Click here to download a copy of our Tracerco Diagnostics™ Services for the Refining and Petrochemcial Industries brochure.
If you want to learn more about how Tracerco's tower scanning technology please complete the form on our contact us page at http://www.tracerco.com/contact-us and request additional case studies or to schedule a lunch and learn presentation.