In any deep water field development it is important to monitor oil and water production from all wells in order to manage fluid movement and maximize hydrocarbon output. The use of Smart Tracers integrated into a lower completion, alongside the use of waterflood tracers, provides a number of advantages over traditional oil and gas inflow measurement technologies, at a fraction of the cost.
One recent application required Tracerco to install 53 unique oil and water Smart Tracers in production wells of a subsea development, along with a number of interwell tracers in seawater injection wells. The oil tracers’ primary use was to verify clean out and long-term oil flow from each of the wells. Water tracers were used to detect the position of water breakthrough along each well and confirm whether the water source was from the formation or injected seawater.
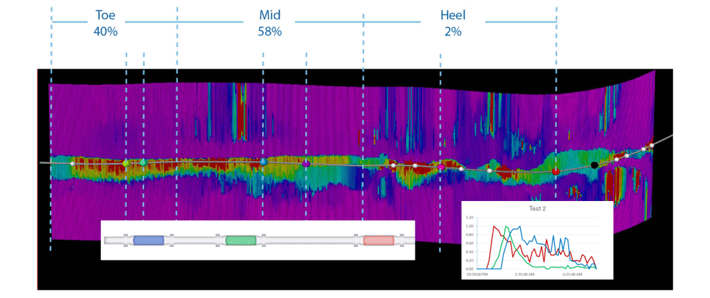
During well start up and pressure build up tests, regular samples of oil were taken from the common flow line transporting fluids from all wells to the production facility. Analysis of tracer response allowed the measurement of average inflow across specific portions of each well. Comparison of reservoir quality acquired during drilling activities matched those inflow parameters measured using the Smart Tracers. Figure 1 shows a typical tracer response and the associated sand quality from within the wellbore.

Figure 1 – Typical Oil Tracer Response versus Sand Quality
Following the onset of water breakthrough, regular samples of water were taken from the comingled flow line and analysed for the presence of tracers. Detection of tracers in samples and knowledge of their position in each of the production wells allowed an assessment of where the water was originating and whether it was injected seawater or formation water. Over time, as more water tracers were produced, comparison of water tracer concentration allowed a comparative map of water cut across all of the wells. Figure 2 shows a typical water response and the comparative water cut between and within each production well.

Figure 2 – Typical Water Smart Tracer Response and Comparative Water Cut from Within and Between Producing Wells
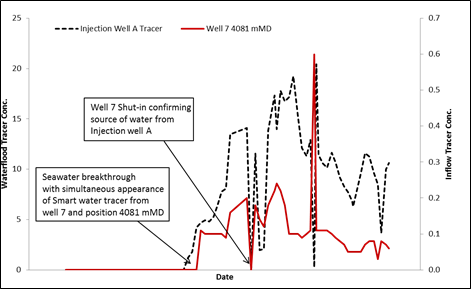
Over time waterflood tracer breakthrough was detected originating from one of the injection wells. In parallel with the detection of the waterflood tracer it was noticed that an additional inflow Smart water tracer had simultaneously appeared. This well was shut-in for a short time period to verify that injection water was flowing into this well. During shut-in the waterflood and smart tracer disappeared from sampled water confirming the relationship between the injector and production well. Tracer response is shown in Figure 3.

Figure 3 – Seawater Breakthrough Tracer Response from Well A along with Well 7 Simultaneous Smart Tracer appearance from position at 4081 mMD
As an example, zone C generally showed a declining production trend with time during the test whilst zone D showed the most stable production during the time period, again suggesting it is the best target for further development.
Information from the initial oil inflow study as well as long term relative water cut measurements has allowed the customer to optimize water injection balance and minimize water production from the wells. Weekly water sampling is ongoing in the field to detect further formation and injected seawater breakthrough as the field continues to be developed.
Watch our webcast on cost-effective long-term fluid inflow measurement to find out more on how our Smart Tracers can allow you to maximise full field potential now and in the future, all at a dramatically lower cost than a standard PLT.
