Baseline scans of a vessel are undertaken when it is known to be clean, operating normally, and in good mechanical condition. They are often used for comparison purposes on future troubleshooting scans. Any anomaly, or abnormal absorption observed on a baseline scan, that cannot be explained by a visible external interference or by something indicated in the column drawings, may be able to be eliminated as a potential problem area in future troubleshooting scans.
In this blog, we will discuss with case study examples how our non-intrusive, conducted in real-time Tru-Scan™ and Tru-Grid™ Scans provide information about the mechanical integrity of column internals, as well as, identify several process degrading conditions if they are present at the time of the scan.
Baseline scans can also be utilised as a starting point in monitoring the degree of fouling in certain vessels over time. In addition, baseline scans can be performed after an outage to verify that no damage occurred during start-up, or that cleaning was effective. In the following case study we will cover several field tests where baseline scan data was utilised in a manner that helped our customers save a significant amount of money and time.
The Field Test 1
A petrochemical facility on the Gulf Coast had a trayed column with historical fouling issues and they decided to use Tracerco’s Tru-Scan™ technology to help monitor the progression of the issue. This is so they could be better prepared for future planned outages and possibly modify operations to increase run times. A baseline scan was performed on the column following an outage where the column was cleaned. Then, periodic Tru-Scans™ were performed to help identify any fouling, which would be indicated by denser tray peaks.
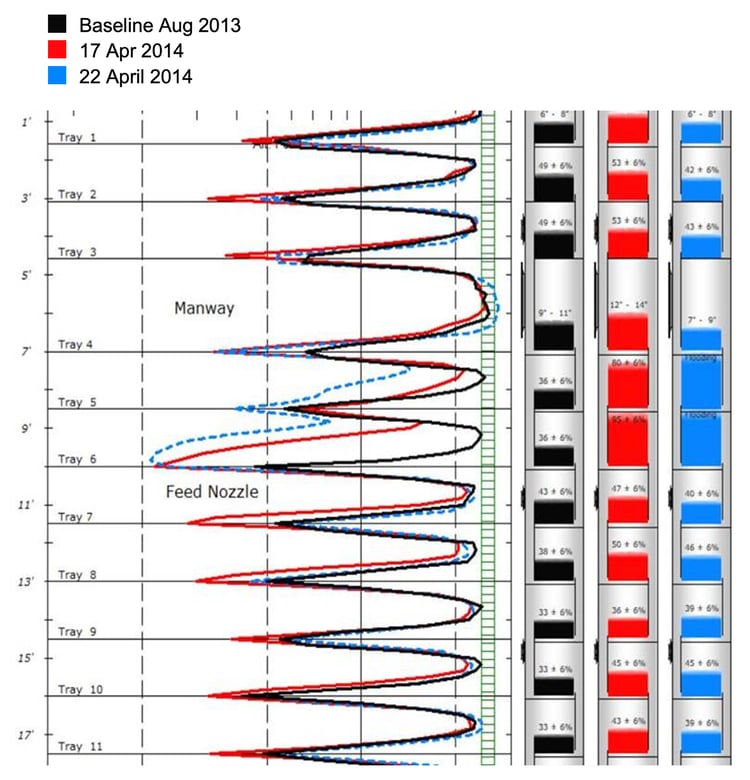
Figure 1 - Scan results helped the customer identify the origin of the fouling within the column, and also helped them to understand the timing associated with this fouling.
Six months after the baseline Tru-Scan™ was performed, an increase in density was observed on the tray peaks, indicating that the fouling process was beginning. Within five days, the column had reached the point where it needed to be shutdown and cleaned again. Figure 1 is a plot of the scan results from the baseline scan (black scanline), and the scans performed when the fouling was first noticed (red scanline) and five days later when they reached the point where a cleaning was needed (blue scanline).
The Conclusion
These scan results helped the customer identify the origin of the fouling within the column, and also helped them to understand the timing associated with this fouling. Once fouling began in this column, it progressed very rapidly. Because they were able to identify the origin of the fouling, they were able to modify operations of the column to lessen the likelihood of fouling, allowing them to extend their run time from six months to a year, cutting the number of outages for cleaning in half.
The Field Test 2
A refinery was experiencing a higher than expected differential pressure across one of the columns in its
sulfur recovery unit, along with off specification product. They decided to utilise a Tru-Scan™ of the column to help diagnose their issues. The scan results in Figure 2 indicated an increased tray density on tray 15, compared to the other trays peaks of the scan, and flooding on tray 14 as illustrated by the blue scanline. This profile of increased density that was seen on tray 15 is often indicative of fouling.
The plant decided to try to alleviate the fouling by performing an online chemical wash of the column. Less
than two weeks following the initial scan of the column, the cleaning had been completed and column operation had returned to normal. As such, the facility decided to perform another scan of the column, shown as the red scanline in Figure 2, to verify the effectiveness of the cleaning and use as a baseline for future analysis. This scan revealed that the flooding had been eliminated, as well as the fouling indicated during the initial scan.
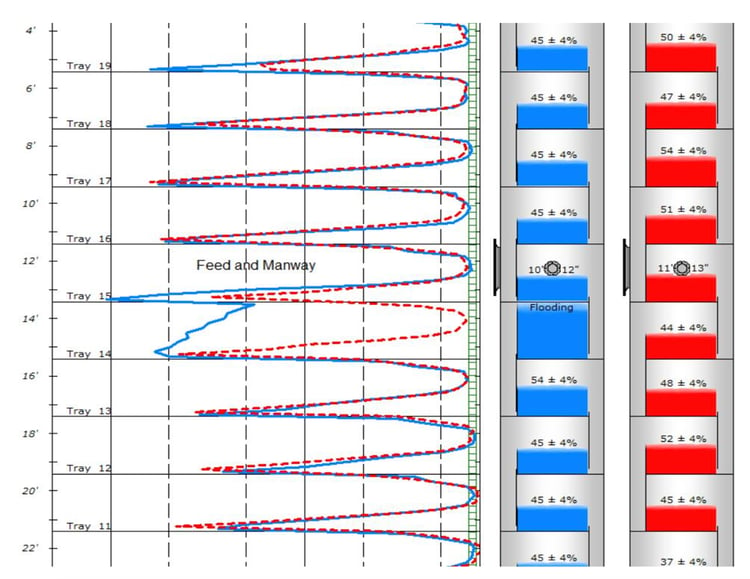
Figure 2 - The data that was collected from these Tru-Scans™ allowed the facility to make the decision that an outage may not be needed to alleviate the issues they were experiencing.
The Conclusion
The data that was collected from these Tru-Scans™ allowed the facility to make the decision that an outage
may not be needed to alleviate the issues they were experiencing, and verified that the decision they made
was effective. This allowed significant savings to the customer in not only the provided costs that would have
been associated with entering the column for inspection, but also a significant reduction in lost production time.
The Field Test 3
A gas processing facility started up following a planned outage. Start-up did not go as smooth as planned, and once up and running, one of the columns was making off-specification product. The column was scheduled to have a baseline scan performed on it, so plant personnel decided to move forward with the plan to scan the column. The Tru-Scan™ results of the column, shown in Figure 3, indicated little to no absorption for the two bottom trays of the column, a profile normally associated with tray damage. This was both good and bad news for the facility. The start-up did indeed damage a couple of trays in the column, but with only the bottom two trays damaged, they were able to continue to operate until there was an opportune time to shutdown again to make the needed repairs.
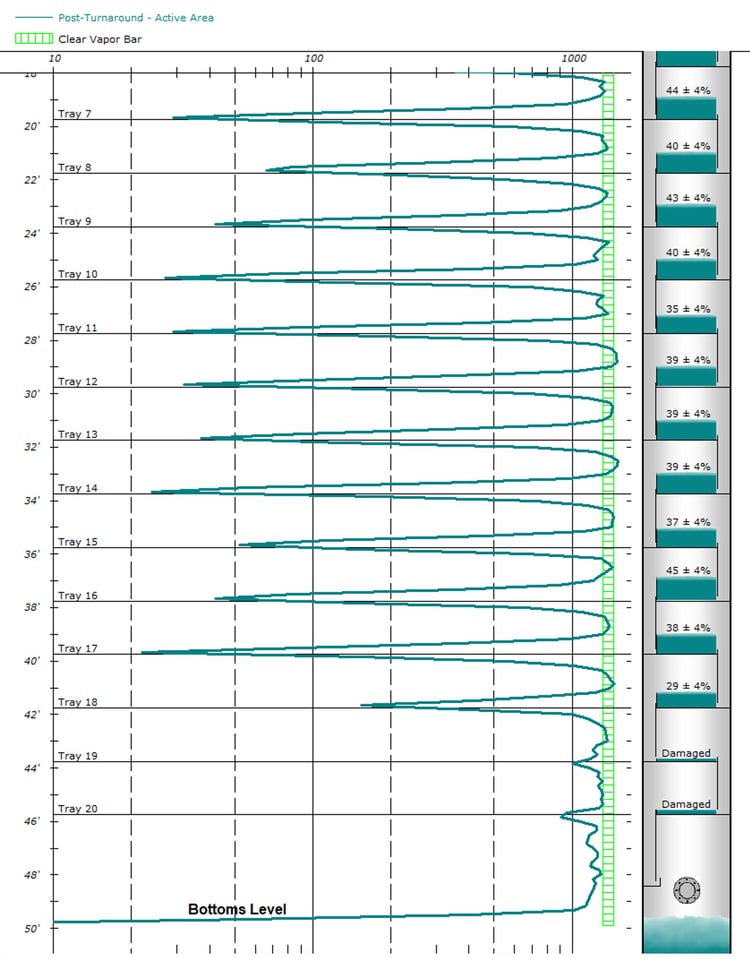
Figure 3 - Tru-Scan™ results of the column, shown in Figure 3, indicated little to no absorption for the two bottom trays of the column, a profile normally associated with tray damage.
The Conclusion
When that time did come, they were aware of exactly what needed to be repaired and had the required parts onsite, lessening the amount of downtime. This also gave them a better idea of how they needed to run the column to achieve maximum yields until then.
The Field Test 4
A petrochemical facility installed a new distillation column and decided to perform a baseline scan of it once it was up and running at full rates. The column was thought to be operating normally and making good product. The initial Tru-Scan™ was performed and indicated what seemed to be very heavily loaded, flooded trays, as shown in Figure 4.
However, something did not seem right, since the product was on specification and the differential pressure across the column was close to expectations of normal operations.
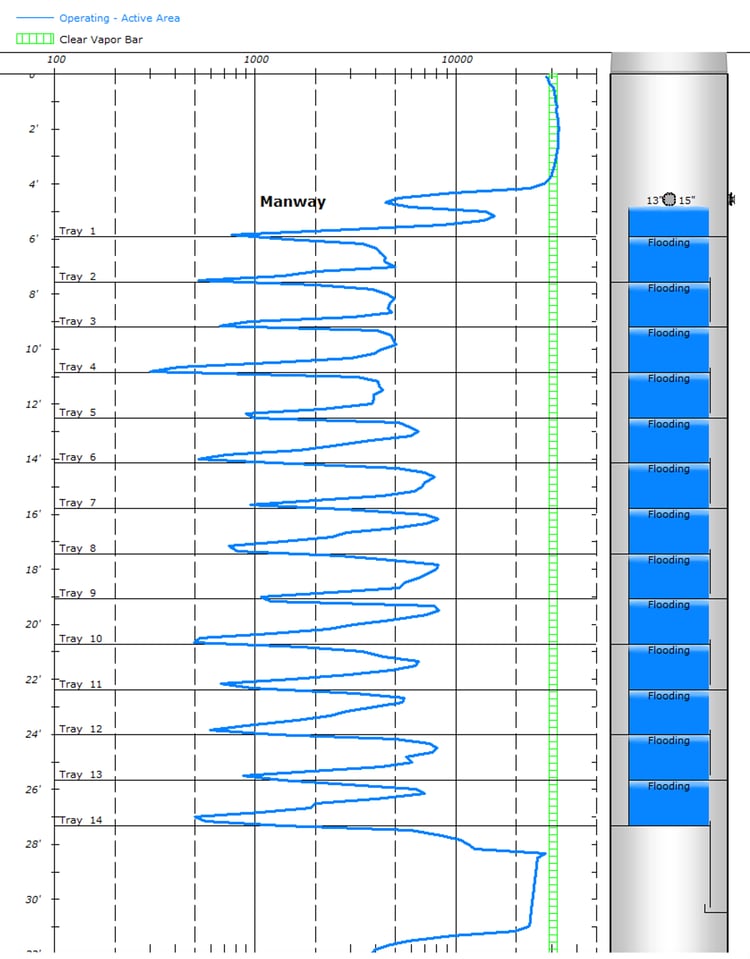
Figure 4 - The initial Tru-Scan™ was performed and indicated what seemed to be very heavily loaded, flooded trays.
Upon further investigations of detailed drawings and conversations with plant personnel, it was determined that there were some larger than normal tray supports installed below each tray. Were these supports large enough to give the appearance of flooding on a gamma scan? One way to find out was to shut the column down and perform a dry baseline scan of it. Trayed towers are not typically scanned dry, because the effects of normal tray parts and supports on the density profile are minimal compared to the effects seen by the liquid held up on each tray. However, in this case with very large tray supports present, the effect could
be significant.
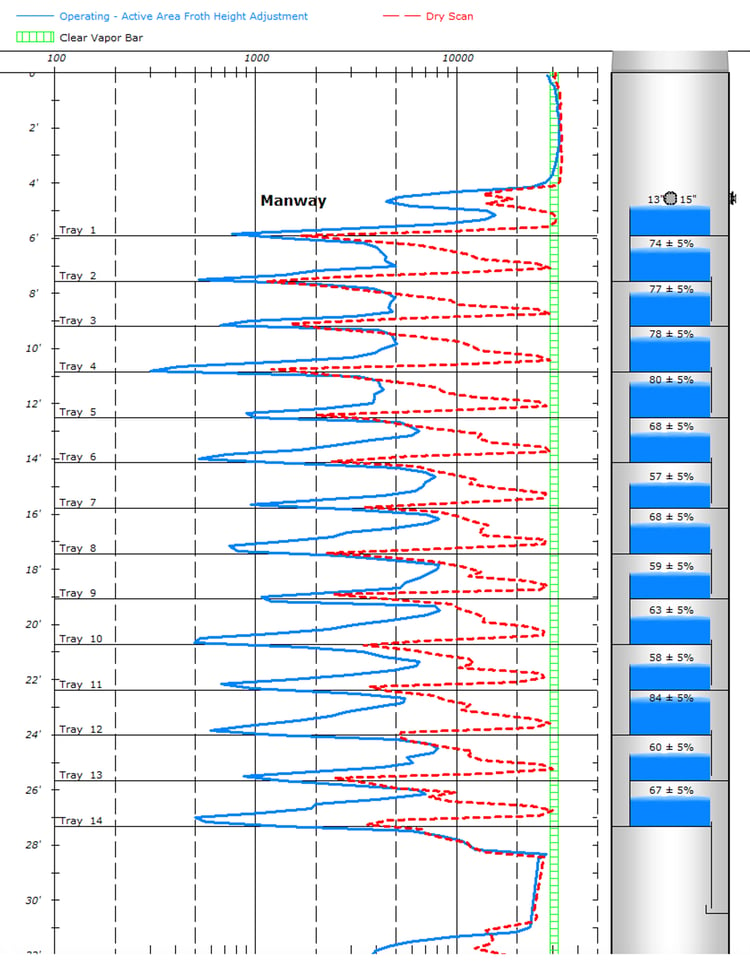
Figure 5 - The dry baseline (red scanline) was overlaid with the initial operating scan (blue scanline) with adjusted froth heights calculated.
Once the dry scan was performed, it was evident that these tray supports were indeed large enough, and their effect on the density profile was great enough, to alter the analysis of the scan data. Figure 5 includes the dry baseline scan (red scanline) of the column, where the large absorption of each of the tray supports is seen, as well as, the initial operating scan (blue scanline) with adjusted froth heights calculated. In this case, the dry baseline scan proves critical in diagnosing any potential future problems with the column via Tru-Scans™.
As you can see from these field tests, many operators have used baseline scans to eliminate the uncertainty of initial start-up problems in their columns, and to obtain initial data on the integrity of columns to aid with any future troubleshooting. Baseline scans are a proven method for saving both time and money for operators around the globe.
Our innovative work gives customers the insights they need to help solve their problems. To learn how scanning and tracer diagnostic services can help you quickly identify, resolve and improve operational issues, optimise and run your processes more efficiently and potentially save you millions of dollars every year watch our webinar; optimising processes with data driven diagnostics solutions.