Every refinery invests a tremendous amount of time and money in planning a unit turnaround. Scheduling of the tasks, manpower and equipment has to be detailed and thorough. In order to plan, information is needed about the process system so that critical tasks can be planned to meet turnaround time constraints. Some of this condition-based information is gathered using tools such as gamma scans, radiography, ultrasonic probes, vibration monitors, acoustic sensors, and other non-destructive techniques whilst the process is still operating. It is vital to be aware of any internal damage to distillation columns, heat exchangers, reactors, and other vessels to avoid surprises that can disrupt the turnaround schedule. Each day of downtime is a day of lost production, so it is critical that a turnaround is not extended due to unexpected repair work.
In this latest blog, we will discuss how InDepthTM technology was used to collect data about coke build-up on refractory lining in a 48" pipe connected to the flare stack.
Case Study
InDepthTM is a new inline inspection tool that measures the depth of refractory or coke buildup inside a steel wall. A 48” pipe had coke build-up when inspected during a turnaround and the current state of build-up was of concern. The refractory lined pipe mostly ran horizontal in a pipe rack with platforms around the pipe as it exited the support rack (as shown in Figure 1). InDepthTM was deployed on each side of the pipe, as shown in Figure 2 at this position.

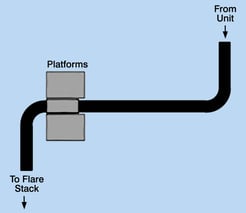
Figure 1: Illustration of the platform Figure 2: Scan orientation illustrating
locations around the pipe surveyed InDepthTM set-up along the pipe.
Four horizontal lateral scans along each side of the ducting were carried out. The first was 80 cm above the centreline of the pipe. The remaining three were 60 cm, 40 cm and 20 cm above the centreline. The side toward the flare stack was tested first.
Analysis
The results from the flare stack side are presented in Figure 3. The results were entered into a "heat map module" that interpolated the space between the data points to produce a 3-D picture. Results in Figure 3 show that between the 70 and 80 cm marks (222 and 232 cm from the weld line), 5 cm (2 inches) of refractory was present. Moving to the left side of the plot, the thickness of material indicated increases to over 8 cm. Because there was definitive density for the coke, it was assumed to be 2000 kg/m3 (2 g/cc). As shown in the plot, there were various depths of coke measured between 0 and 3+ cm with an accuracy of +/-0.5 cm. It should be noted here that the plots were set-up under an assumption that the refractory was designed to be 5 cm thick and the pipe was assumed to be 1 cm thick, as per the drawings provided. The plot from the other side of the pipe is shown in Figure 4, with the blue indicating areas that could not be scanned due to interference. The plot results showed that there was very little coke deposition on this side of the pipe; no more than 1 cm. The rest of the plot indicated 5 cm of refractory.
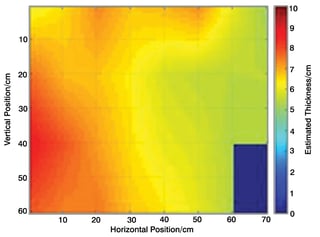

Figure 3: Survey results shows that there Figure 4: Results indicate very little coke
were various depths of coke between 0 and 3cm. deposition was found on the second side of the pipe surveyed.
Conclusion
Based upon the InDepthTM scan results, the pipe appeared to have significant coke deposits on top of the refractory on the flare stack side of the pipe and a small amount on the opposite side of the pipe. This information provided the customer with data regarding the amount of coke that had been deposited since the last turnaround that the client can use as part of the safe operations review process for the flare line.
InDepthTM provides detailed online inspection data to turnaround planners who have refractory lined process vessels and pipes. Data provided by InDepthTM assists with managing turnaround schedules, and reducing unnecessary allocation of resources as well as materials in areas where no problems are indicated. Scan results can help planners avoid any potential surprises in areas where refractory loss may have unexpectedly occurred. Hence, pre-turnaround preparation can be optimised by avoiding the risk of extending the planned outage.
If you want to learn more about how Tracerco’s process diagnostics technologies enable you to make the right decision, request more information.