Improving process operating margins can be achieved by maximising production of higher value products and/or minimising production costs. It is important for plant engineers to know how much capacity is available in the trays in a distillation tower. Gamma scanning is an established method used by many in the process industries as a qualitative tool to help troubleshoot distillation towers. Gamma scanning can be used to diagnose virtually any operating malfunction that can be identified by an observable change in density. This includes most mechanical, process or rate related problems such as tray damage, foaming, weeping and entrainment. By deploying new measurement detector technology and incorporating innovative analysis of gamma scanning data, plant engineers can now acc ss the all-important quantitative data about the capacity of distillation towers.
In this latest blog post, we will explain how Tracerco’s Tru-Scan service utilising gamma scanning technology provides reliable information on distillation column performance whilst the column is online and operating at design and reduced reflux rate conditions. Used in conjunction with analytical data gained by measuring the froth height, plant engineers now know the total available capacity of the trays in a tower.
Project Field Test
A column had been experiencing poor separation, higher-than normal pressure drop, and unacceptable carryover. Because the column had recently undergone a major retrofit, the customer was convinced that the column had either sustained damage during re-commissioning or was experiencing problems relating to poor column design. Tru-Scan™ services were performed twice on the column under different operating conditions. The first shown in the image below (green-dashed line) was at design conditions. At design rates the column was delivering off-spec performance. After reviewing initial scan results onsite, it was agreed to scan the column a second time at reduced reflux rates. The second scan is depicted by the blue (solid) line. The scan plot results focus on the top seven trays of the column.
Summary of results and the first scan at design rates (green-dashed line):
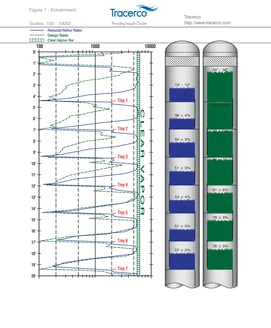
Results of the scan at design conditions found that the mist eliminator above Tray 1 was in place with liquid from Tray 1 being entrained upwards, saturating it. The allowable liquid/vapour disengagement space between the froth height and the tray above was greatly reduced on Trays 2 - 4. In general, a single-point, reduced vapour space is a tell-tale sign symptomatic of moderate-to-severe entrainment. The total froth height on Tray 1 was 86-91cm (34-36in), nearly reaching the elevation of the mist eliminator. Trays 2, 3 and 4 had total froth heights of essentially100% or the total tray space was filled with froth - the classic definition of flooding. The trays below Tray 4 appeared to be operating normally with good vapour/liquid disengagement.
Summary of results and the second scan at reduced reflux rates (blue solid line):
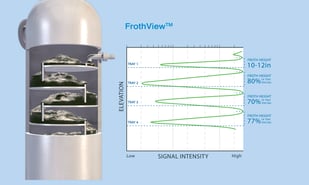
Results from the second scan at reduced reflux rates showed all trays were found to be in place with no evidence of damage. Tray 1 held 25-30cm (10-12 in) of total froth which is much more typical. Tray 2 held a total froth height of 97cm ±3% (38in +3%) of tray spacing and the trays below Tray 4 had similar froth levels. These trays now had clear vapour spaces between the trays rather than the flooding seen earlier. At the reduced reflux rates the column appeared to be operating normally.
Customer Conclusion
Based upon the Tru-Scan™ data, the customer conducted a thorough investigation that focused on the reflux rate entering the column. The reflux rate set point should not have caused the trays to flood. Confident that the tray design was correct and that the trays had been installed correctly, the only other explanation was a reflux rate greater than what the flow instruments indicated. The investigation found that an orifice plate in the reflux measuring system had not been installed properly, therefore the measured reflux rates had been greatly understated. The poor column performance had been a direct result of too much reflux flow, and not tray damage or improper design. This study not only eliminated an unnecessary unit shutdown and column inspection, but enabled the customer to achieve on-spec production at higher unit feed rates. Tracerco has used this same approach numerous times with other customers to identify the root cause of an operating problem. This is especially true with entrainment concerns, or to give the customers additional insight as to what is physically taking place inside their columns at adjusted conditions. Tru-Scan™ services have proven to be cost effective by reducing off-spec production and equipment downtime. If you want to learn more about how Tracerco technologies provide insight onsite, request more information.